Spiel des Jahres & the BGG Community - Part 1
Setup
Though some table top gaming enthusiasts believe that the Spiel des Jahres annual awards are not relevant for them, there is no doubt that these awards are important drivers in table top games in general. There is enough urban legend and pontificating about the awards that don’t report the facts that a deep dive into the statistics related to the awards is perfect for an article in the Analysis Paralysis series. Through this analysis, we will have a better idea of what makes a Spiel des Jahres game, the common aspects of the games that have been named in the awards – as winners, nominees, or recommendations – and how the awards have changed over the years. In particular, we will viewing this information through the lens of the BGG community (as expressed in the game and user data available on the BGG website). Eventually, we will also be able to compare data for the 2017 nominees before and after the awards to gauge the impact.
Round 1: What is the Spiel des Jahres
From the Spiel des Jahres website FAQ: “’Spiel des Jahres’ is an award for analogue tabletop games in German-speaking countries, which was first’ awarded in 1979. German-language games released in the current and previous year can be considered for the award.” The Spiel des Jahres is awarded annually by a jury of independent “games critics”; journalists and analysts that report on the German language table top game market. A complete description and the awards can be found on the official Spiel des Jahres website. The website is natively in German, but an English version is available for most pages. Currently, the award is actually three awards differentiated by their expected audience, but that has not always been the case and will be the subject of future articles. The awards are:
- Spiel des Jahres (SDJ) – The original award commonly referred to as the “family and friends” board game of the year. (First awarded in 1979.)
- Kennerspiel des Jahres (KSDJ) – Focuses on games for more advanced gamers or “connoisseurs”. These games are often popular games on BGG and are included in this analysis. (First awarded in 2011.)
- Kinderspiel des Jahres – Focuses on games specifically for children. These games often do not make it to the North American market and are typically not of great interest to the BGG community, so I have not included them in this analysis. (First awarded in 2001.)
We will also look at the games mentioned in the awards that were not winners – what we will call the Award Level. These are generally:
- Finalist – the games nominated for the award, but did not win.
- Recommended – other games considered that did not make the nominations, but are recommended by the jury.
- Special – other games that received special recognition in addition to the recommended games. Usually a game that was considered to meet the quality criteria for the awards, but is outside the specific audience.
Round 2: A Very Brief History of the Award(s)
The first Spiel des Jahres was awarded to Hare & Tortoise in 1979 which, as we will see, seems very appropriate given how well this game represents the collection of games that have won the SDJ over the years. Since then, the award has been consistently awarded annually, but the number and type of awards and nominated games have changed over time. The number of nominees for any of the awards has typically been three games, but that is not a hard rule.
Although the award had a relatively specific target audience, the range of qualifying games spanned a greater audience than a single award could represent so in 2001 the Kinderspiel des Jahres was introduced to acknowledge children’s games and in 2011 the Kennerspiel des Jahres was introduced to give similar recognition to more advanced games. Along the way there were 1 to 3 special awards given in 21 of the 31 years between 1980 and 2010.
Round 3: The Statistical Data to be Analyzed
The data presented in this series of articles is completely derived from and available on the Spiel des Jahres website and BoardGameGeek.com. I have not listed the game pages individually, but all credit for the acquisition of the data goes to the BGG team and user community. I have consolidated the data and analyzed the results. There are 232 games mentioned in the awards. The specific data used from BGG includes:
- BGG Rank
- BGG Category Rank
- BGG Rating
- Average BGG User Rating
- BGG User Game Weight
- Published Game Play Time
- Published and BGG Community Age Range
- Published and BGG Community Player Count
- BGG Game Type Categories
- BGG Mechanics Categories
Round 4: Challenges within the Statistical Data
As always, there are some challenges in analyzing the BGG data. In this case the greatest challenge is the time it takes to collect, evaluate, and report the data compared to the mobility of the data. So I can’t say that this data represents a point in time. It more accurately represents several points in time. The impact to the data and analysis should be negligible since we are looking at averages and trends over several years. In particular, however, the data for the 2017 nominees (and to a much lesser degree the 2016 nominees) is changing rapidly as these games are being discovered and reviewed for the first time by a much larger audience than before the announcement of the nominees. However, the change in the data is instructive as well. For the 2017 nominees we may be able to gauge the impact of the awards.
There is also a slight limitation in that some of the mentioned games are not listed on BGG. This is a small number, though, only 3, so does not have a large impact on the data. Another 6 games do not have a BGG Rating or Rank (they have too few User Ratings), so the data is limited on these. Several others also have a small number of user responses to the community statistics (Player Count, Weight, etc.), so do not have a statistically good numbers for those aspects. However, I used all of the data available.
End Game
Over the next several articles we will look at BGG statistics regarding Spiel des Jahres mentioned games from its first year (1979) through the current year (2017). If you have any interest in the awards, you should find this information interesting. Even if you think that the awards are too focused on children and family games, you may be surprised by the data. This analysis will include many graphs for you to make your own judgements. If the analysis sounds interesting, subscribe to the series or watch for future articles to stay informed.
Additional parts to this article are available here:
- Spiel des Jahres & the BGG Community - Part 1
- The Full Weight of the Spiel des Jahres - Part 2
- How do Spiel des Jahres Winners Rate? – Part 3
- Industry Focus: Buy and Play Spiel des Jahres Games– Part 4
- Industry Focus: What Makes an SDJ Winner? – Part 5
- Industry Focus: The Impact of SDJ Consideration – Part 6
Your Turn
Do you pay attention to the Spiel des Jahres awards? Do you find that the Kenner Spiel des Jahres award is more relevant to your gaming preferences? Before getting into the data, think about what you believe about the awards and check how that changes when you see all the data.
Flavor Text
I have staged a significant amount of data and analysis for these articles, but am waiting on the 2017 award winners to be announced to publish it. With the awards for SDJ (Kingdomino) and KSDJ (EXIT: The Board Game) yesterday (July 17), the series will be published over the next several weeks. (Note: after having immersed myself in these awards for the last few weeks, my unpublished predictions were correct – you’ll have to take my word on that). I will update this article with an index of the other articles so you can jump to the ones that most interest you.
Based on the dialog about the awards on gaming podcasts and forums, I was originally interested in the game weight and the rank/rating, but expanded my discovery to the other statistics.
The Full Weight of the Spiel des Jahres - Part 2
Setup
The Spiel des Jahres (SDJ) award is intended to recognize games for “family and friends.” Does it hit that mark? The Kennerspiel des Jahres (KSDJ) was created to recognize more advanced games. Anecdotally, this is obvious from the difference in games that have won the awards, but is there a way to quantify this difference? Not dissimilar from other media, the complexity level of a game is represented by what gamers generally call “weight,” which is available as a community contributed measurement on BoardGameGeek.com. All graphs have been derived from data obtained from BoardGameGeek.com in June and July 2017.
Let’s take a look at the weight of SDJ and KSDJ winners and nominees over the years for insight into their level of complexity:
- What are their average and relative weights?
- Have their weights changed over the years? (Are the games getting more or less complex?)
- Have there been major changes over the years? What were the likely events that caused these changes?
Note: If you are starting your reading with this article, you might want to jump to the introduction here: Spiel des Jahres & the BGG Community Part 1
Round 1: What does Weight Mean?
The BGG Weight rating is intended to quantify the complexity of a game, how difficult is it to learn and play – not to be confused with how difficult it is to win. The value reported for each game is based on community votes given the following recommended weights:
- Light
- Medium Light
- Medium
- Medium Heavy
- Heavy
Data Note: Although this is a 5 point scale, it is important to note that the lowest rating is 1.00 and the highest is 5.00, so there is really only a potential 4 point difference between the lightest and heaviest game ratings.
Round 2: Average and Relative Weights
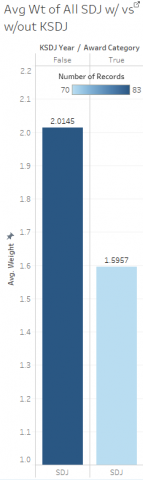
First, let’s look at the average and relative weights of the games mentioned in the two awards. Note: This graph excludes the games given “Special” awards. We will look at them later. For the following graphs, the height of each bar represents its weight (also indicated with a number at the top) and the color of the bar represents the number of games included in the calculation for that bar.
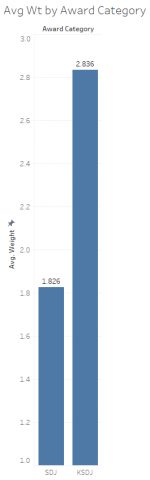
The average weight of the SDJ games (winners, nominees, and recommended) is 1.826 – just under “Medium Light” and the average weight of the KSDJ games (winners, nominees, and recommended) is 2.836 – just under “Medium.” Neither of these ratings is surprising to me. The KSDJ games are a full point, 25% (if we can think of it that way) more complex than the SDJ games.
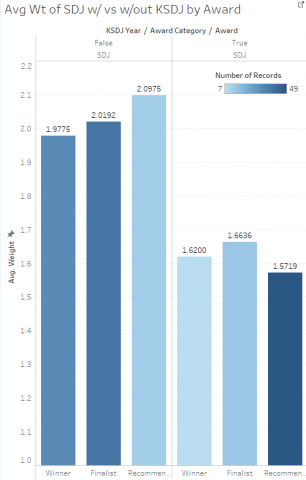
Now, let’s break the data down a bit further and look at the different statuses (winners vs. nominees, etc.). This time we will include the “Special” awards as well.
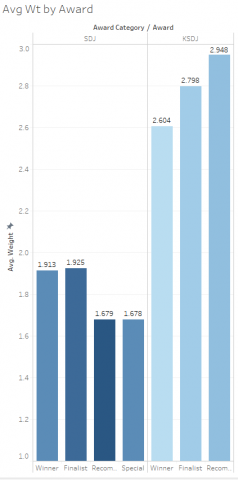
Although the difference is very small, I am surprised to see that the SDJ winners are a fraction more complex (+0.087 or 5%) than the average game considered for the award. The finalists represent the most complex games. The difference is greater for the KSDJ games, but in this case the winners are measurably less complex (-0.232 or 8%) than the average game in consideration. In this case, the recommendeds represent the most complex and winners the least.
So far we have been talking about averages, but since a main interest to the typical BGG user is heavier games, a look at the maximum weight for each award might be interesting.
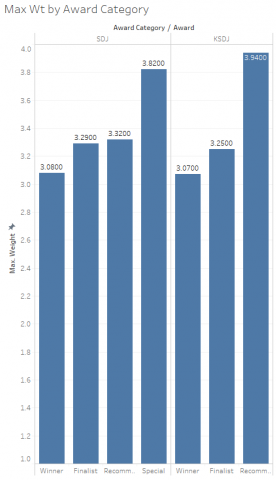
Even if nothing has been surprising so far, this data should get your attention. First let’s look at the SDJ winners. The max weight of a winner (3.08, a solid “Medium”) is 1.167 heavier than the average (1.913, “Medium Light”). The difference for recommendeds is the greatest at 1.641 (3.32 vs. 1.679).
The difference for KSDJ winners is also large, but not as drastic, at 0.466 (3.07 vs. 2.604). As with the SDJ, the recommendeds represent the greatest difference at 0.992 (3.94 vs. 2.948). The heaviest game here, at 3.94 (a solid Medium Heavy weight), is very heavy in comparison to the general population of games on BGG. There are very few games on BGG with weights over 4.
The fact that the recommended games for each award show the greatest difference makes sense. These games were considered for the awards, but did not make the finalists; possibly because of their weight.
Given the great differences in the SDJ winners in particular, several questions arise:
- What games were these and when were these heavy games considered for the awards? (from left to right on the graph)
- SDJ Winner (1996): El Grande
- SDJ Finalist (2002): Puerto Rico
- SDJ Recommended (2011): Luna
- SDJ Special (2006): Caylus
- KSDJ Winner (2012): Village
- KSDJ Finalist (2017): Terraforming Mars
- KSDJ Recommended (2013): Terra Mystica
- Were these games just outliers or has there been a trend over time? We’ll look at that in the next section.
- What’s with the Special awards? They have the biggest difference at 2.142! We’ll look at the special awards in a section by themselves a little later, but will refer back to this graph.
Round 3: Weight Trends
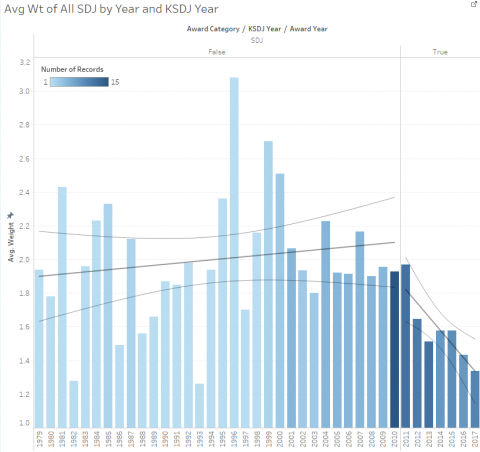
First, let’s look at the average weight of games for each award by year (excluding Special awards).
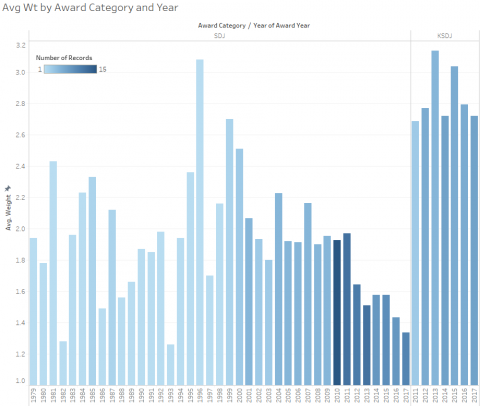
First, a side note: As indicated by the color of the bars, the number of games considered and recognized in some way has grown significantly over the years. The SDJ jury is a busy organization these days.
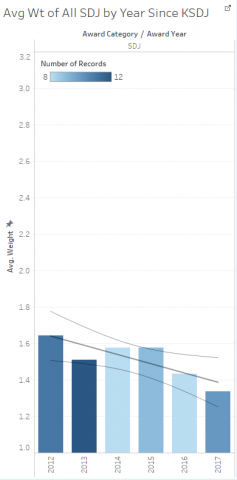
As before, the difference in the average weight between the SDJ and KSDJ games is obvious, but let’s look a little closer. The KSDJ award is intended to recognize heavier games so it makes sense that the average weight of SDJ games would have dropped since the introduction of the KSDJ. Looking at the SDJ average weight for the years 2011 to 2017 this appears to be true and is verified in the following graphs showing the average weight of SDJ games in a year with a KSDJ award (True) and without (False).
OK, so this is no surprise, but it is validation of the SDJ jurors’ intent.
While the average weight of considered games was rising during the years leading up to the introduction of the KSDJ, it has dropped significantly since the KSDJ has been an option. (Excluding 2011, when it appears that the SDJ/KSDJ distinction was in transition, the awards show a distinct step down.)
However, throughout the SDJ award history, though the considered games were gaining in weight, the weight of the winner has been fairly consistent until the introduction of the KSDJ.
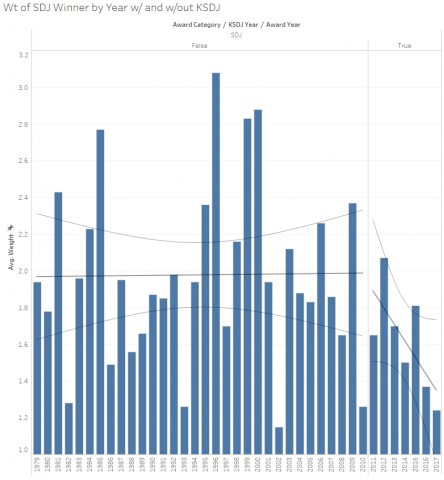
Even when eliminating the “transition year” (2011), there is a trend toward lower weight.
The trend is even more dramatic when looking at the maximum weight of games considered.
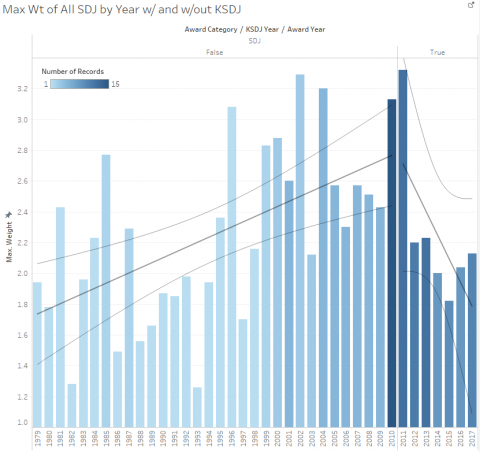
Not that the SDJ jurors need any justification for what they do, but this does show that more heavy games were considered, but were losing out to the Medium Light games.
Note: There are only 7 years since the KSDJ, so the data is easily skewed. It will take a few more years to see where the SDJ settles out in the post-KSDJ years.
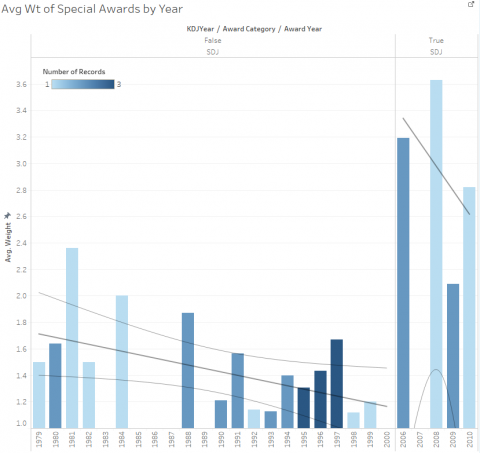
Round 4: A Special Case
Finally, let’s look at the “Special” awards. Over the years the SDJ jurors have awarded “Special” awards to games that were not otherwise considered for the SDJ award. This practice appears to have stopped since the introduction of the KSDJ. A look at the weight of games given this award provides some insight into their history. Prior to the introduction of the Kennerspiel des Jahres (KDJ) award (the Children’s game), these awards tended to be Light games and the trend was lighter toward 2001 when the KDJ was introduced. Once the KDJ was introduced, the weight of games awarded the Special prize immediately jumped up to KSDJ weight games.
End Game
Although there are no major revelations in this analysis, based on the typical reference to the SDJ as only light games, it is a bit surprising to see the number of weighty games getting some love over the years – even before the KSDJ.
The SDJ jury appears to have responded to the changing tastes of their audience by introducing the Kinderspiel and Kennerspiel at times when the market had broadened for lighter and heavier games
Additional parts to this article are available here:
- Spiel des Jahres & the BGG Community - Part 1
- The Full Weight of the Spiel des Jahres - Part 2
- How do Spiel des Jahres Winners Rate? – Part 3
- Buy and Play Spiel des Jahres Games– Part 4
- What Makes an SDJ Winner? – Part 5
- The Impact of SDJ Consideration – Part 6
Your Turn
Do you ever use the BGG weight as a factor in deciding whether you are interested in a game? What is the typical weight of the games you like to play? Are that SDJ and KSDJ game weights surprising to you? Have you considered these awards in you game buying and playing interest? Does the data change your mind about your reliance on them?
Flavor Text
This is the data that I was originally collecting to analyze, so it is the best place to start. However, as I started digging into the data, I saw other factors that may provide interesting analysis and possible insight into these prestigious awards.
How do Spiel des Jahres Winners Rate? – Part 3
Setup
Considering the statement made in Part 1 regarding the relevance of the SDJ to the BGG audience, let’s take a look at how the games considered for the SDJ rate on BGG. This rating begins with the Average User Rating, which drives the BGG Rating (which considers the number of User Ratings), and ultimately the BGG Rank (which stacks the BGG Ratings up against each other). Although, BGG Rank is ultimately the most interesting and will have the greatest focus in this article, we will look at some statistics about the SDJ and KSDJ games in the order that the BGG Rank is built: User Rating –> BGG Rating –> BGG Rank. All graphs have been derived from data obtained from BoardGameGeek.com in June and July 2017.
Note: If you are starting your reading with this article, you might want to jump to the introduction here: Industry Focus: Spiel des Jahres & the BGG Community Part 1
Round 1: User Rating
Are the SDJ and KSDJ games the kind of games that BGG users want to play? Let’s take a look at the User Ratings to get an idea. Unfortunately, I have no way to calculate Average User Ratings across the population of BGG listed games for comparison, so this analysis is a bit subjective – how do these games rate against expectations (vs. other games).
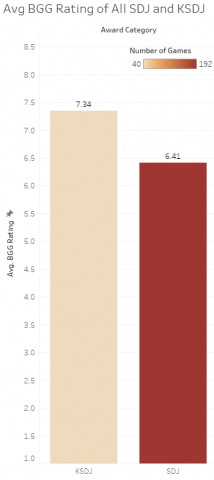
First let’s look at the games by Award Category.
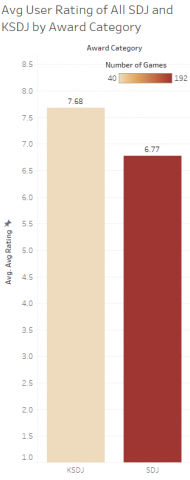
Probably no real surprise here, but maybe they all rate higher with the BGG users on average than one might expect. The KSDJ games rate better on average than the lighter, SDJ games by about a full point (precisely 0.91).
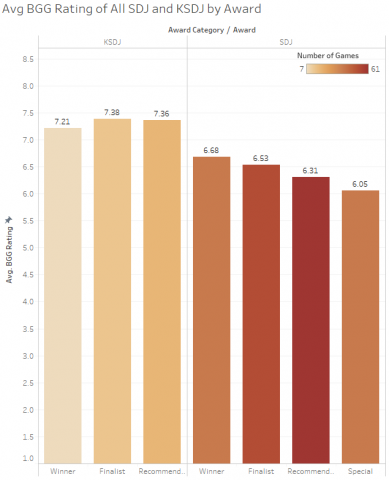
Now let’s break that out into how the games fare within the awards, what I have called the Award Level.
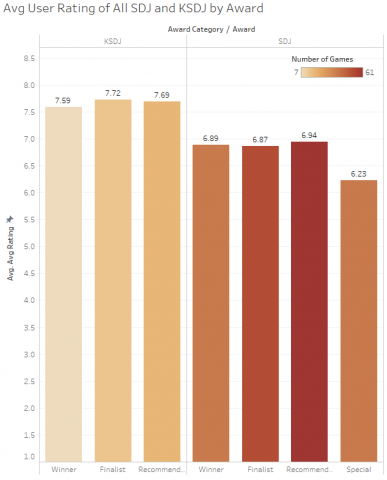
There is not a great distinction among BGG Users for the games mentioned for the awards. For the KSDJ, there is a slight preference for the games that were not the Winners. This is in line with popular opinion that the awards highlight games that are less strategic than the average BGG user wants. Though, the difference is not great, we will see more of this later.
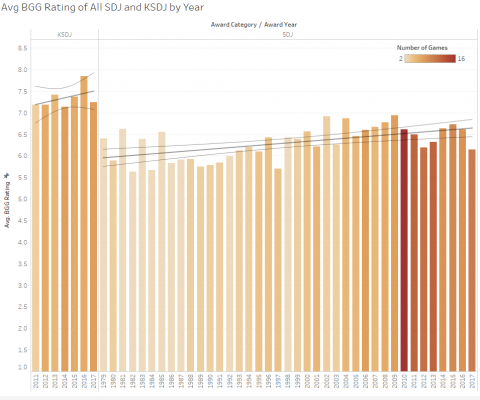
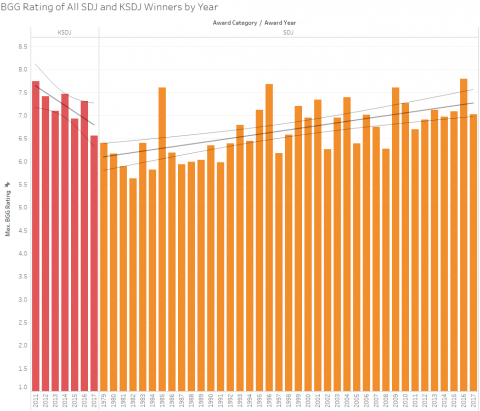
Now the average User Ratings of all games mentioned in the awards by Award Category by year.
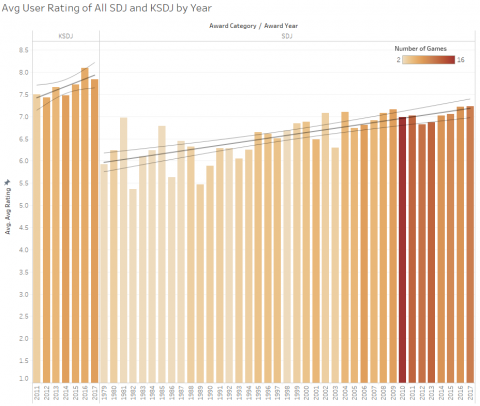
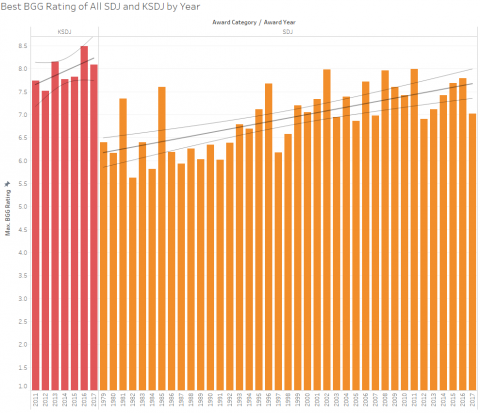
Not surprising, the KSDJ games as a group rate higher than the SDJ games and there is a general rise in rating over time for both Award Categories. The average rating for the KSDJ games in the high 7’s is quite good and the SDJ rising steadily from 6 to 7 is respectable, but not fantastic. However, since these are averages of up to 16 games, there could be some real gems hidden in all the dross. Here are the best User Ratings in each.
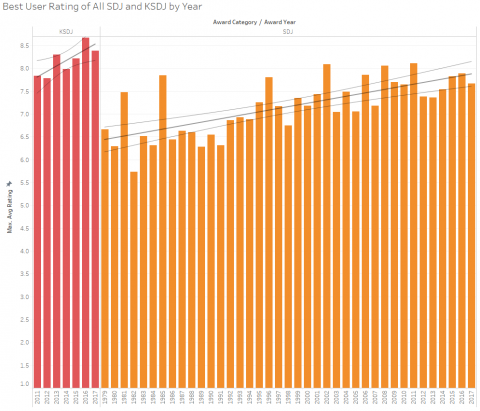
No surprise here. The best rated games are about a half point higher than the average for each year.
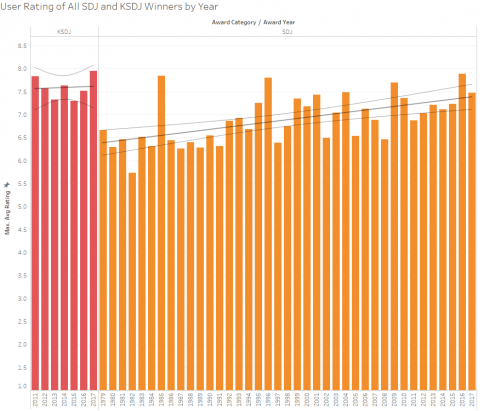
Finally, the ratings trend of the Winners only is not too different from the “best” ratings, so apparently the judges generally get it right… (except Pandemic Legacy: Season 1).
Round 2: BGG Rating
The BGG rating is derived from the Average User Rating with the addition of a factor to account for number of ratings. This is to prevent a game that only has a few very high ratings from shooting up the ranking and is presumably done by seeding the calculation with some number of low or middle ratings as a buffer. I believe that the exact formula is still a mystery, but I suspect that a base rating of about 5.5 for 1000-2000 “users”. There is also a minimum number of User Ratings required for a BGG Rating to be calculated – this helps obfuscate the formula.
These charts should not differ drastically from the User Rating charts except for games that have had limited distribution. It is curious to note that a low rated game with few ratings will actually benefit from the BGG Rating calculation; though, very few of the games in this study meet those criteria. Here are the same trends that were presented for User Ratings with BGG Ratings.
Again, the difference here between the two Award Categories is about a full point (precisely 0.93 – a tiny bit, 0.02 greater than the user ratings). The total difference from the User Ratings to the BGG Ratings is a drop of 0.34 points. This indicates that as a group (not individual games), the BGG calculation for ratings is keeping ratings in check, but not causing a great relative difference.
Now, breaking these out into the Award Level.
Again, other than the 0.34 point drop, there is no significant difference from the average User Ratings. The SDJ Award Level popularity is a little shuffled from the raw User Rating and thre is a small but noticeable decrease in the popularity of the SDJ games as they drop in Award Level.
Now a few charts by year.
Not much to note for the total population of games here, but (comparing to the same graph for User Ratings) the BGG Ratings process has caused a slight leveling as expected.
Now, the best of the best.
Similar to the User Ratings, we see greater discrepancies per year (we aren’t leveling by averaging) and the rise over the years is more drastic. This might suggest that the judges are still considering a broad range of games, including some that have a global appeal and some that are specific to the German market.
And, finally, just the Winners.
Due to the small number of data points for the KSDJ, the trend shows a drastic change, but the actual difference is primarily the change in the rating for the 2017 game (really a game system) EXIT: Das Spiel, which had limited distribution at this time and so had comparatively very few ratings.
We will look at the Special awards separately as well, since the nature of the award has changed over the years.
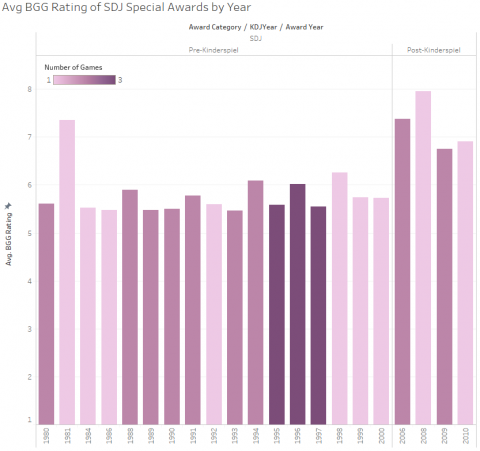
As with the comparisons for game weight in Part 2, we see two different eras of the “Special” Award. With the exception of 1981, when Ra was honored, the Special Award was primarily used to acknowledge lighter, children’s games until the inception of the Kinderspiel Award in 2001. In the four years that the award has been given leading up to 2011 when the Kennerspiel Award was implemented, the award was used to acknowledge heavier games:
- 2006: Caylus, Shadows Over Camelot
- 2008: Agricola
- 2009: GifTRAP (the exception), Space Alert
- 2010: World Without End
Round 3: BGG Rank
The BGG Rank is determined by simply sorting the games by their BGG Rating. Although, this is essentially the same statistic as discussed in Round 2, it has a different effect on the brain so we will take a look at these statistics from a different angle. This is the angle that we will focus most of our attention and rather than focusing on “average rank” which quickly becomes muddy, I have created a few Ranking categories that were convenient mathematically, but also can be described:
- Top 50: These are the “best of the best.”
- 51-200: These are great games.
- 201-500: Many of these were once great games, but have not aged as well as some.
- 500-1000: These get played a lot.
- 1000-2000: OK, but still get played occasionally.
- >2000: Generally forgettable.
A couple notes about my categories:
- Although, this splits the Top 100 that are the basis for the BGG Rankings home page across 2 categories, with the number of high quality games these days, a lot of great games fall into the 101-200 range.
- For perspective, BGG has over 28,000 games listed, so the cut-off at 2000 represents the top 7% of all games listed.
SDJ Considered Games
First, let’s look at the SDJ games (excluding KSDJ) categorized by their position in the awards, the Award Level, and where they rank on BGG. The percentage represents the number of games in that BGG ranking category as a percentage of the games in the Award Level (E.G., All the red “Winners” add up to 100%).
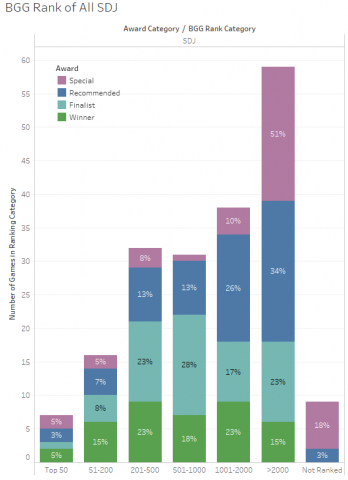
The Winners do tend to rank a little higher than the other games considered for the award – about 20% in the Top 200 vs. about 10% for the other considered games. Here is a look, zeroing in on just the Winners.
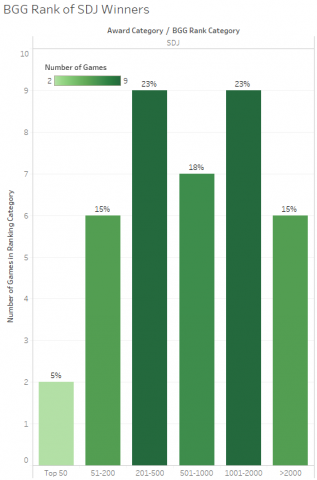
Only 6 of the 39 games are not in the Top 2000, which is a pretty good place to be. For reference, on Jan 16, 2018 these were the rankings around 2000: (a mix of decent strategy games and respected family games)
- 1997 - The Witcher Adventure Game
- 1998 - Pairs
- 1999 - Subdivision
- 2000 - Slide 5
KSDJ Considered Games
Now let’s look at the KSDJ, which we appropriately suspect will rank higher in general on BGG since they are heavier games as shown in Part 2 of this series.
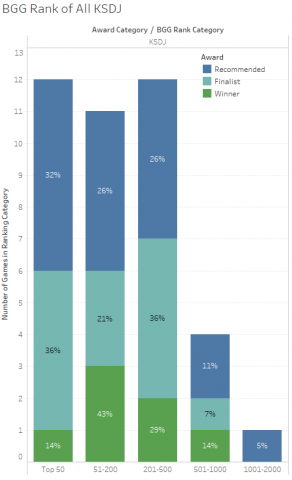
The KSDJ considered games are well represented in the Top 50, with 12 games – that’s almost 25% of the top 50 games in just 7 years of awards – and representing 30% of all games considered for the award. Combine that with the 7 SDJ games and the SDJ awards represent 38% of the Top 50 games on BGG. Not a bad showing. A whopping 88% of all games considered for KSDJ rank in the Top 500 games.
The big difference between the SDJ award and KSDJ Award Categories is the representation of the Winners in comparison to the other games considered. In the SDJ games we saw the Winners lead the way by 2x over all others in the Top 200. For the KSDJ we see almost a dead heat at 57-58% in the Top 200, and the Finalists and Recommended games well ahead in the Top 50.
Round 4: BGG Rank by Year
SDJ Considered Games
Games move up and down the BGG rankings over time, but for the most part, newer games rise and older games slide down. Since the SDJ has been awarded since 1979, there are a lot of “old” games in this collection of SDJ Winners and considered games. Let’s take a look at how well the SDJ games have aged as measured by their BGG ranking.
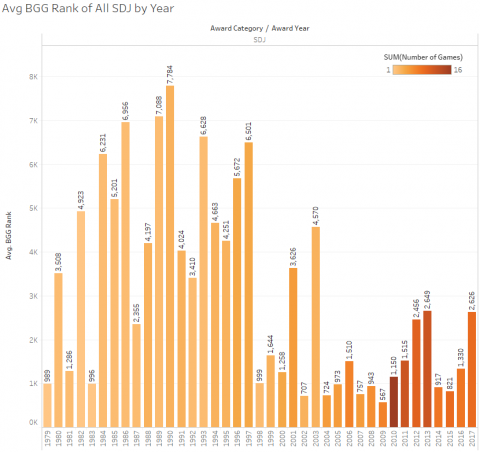
From this graph it appears that some older games have become classics and newer games may not be faring as well as we might expect. As with the comparisons on game weight in Part 2 of this series, it appears that the SDJ games were gaining popularity until the KSDJ was started when there was a slide in the ranking as the SDJ was awarded to very light games and the KSDJ replaced the honors for heavier games. Note: The results for 2017 were captured right at the time the award was announced so we will see in a later article if the ranking improves with the familiarity promoted by the award itself. Note: There are a few games over the years that are not ranked at all (9 of the 238 games in the survey), so these have been removed for the purpose of calculating an average and may have affected the results for specific years. (EX: There were 2 games in 1979, one ranked 989 and the other not ranked).
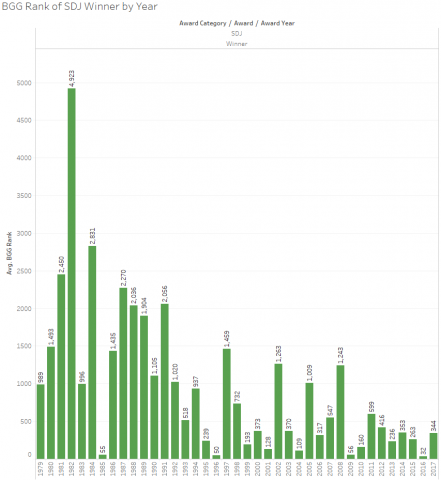
Narrowing this down to just the Winners each year, we get a better picture of how the award ranks when the obscure family games that never break out of just the German market are removed.
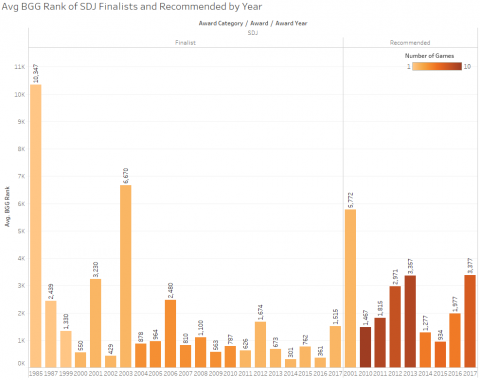
Finally, the rest of the SDJ considered games by Award Level.
Again, let’s look at the Special awards separately, since the nature of the award has changed over the years.
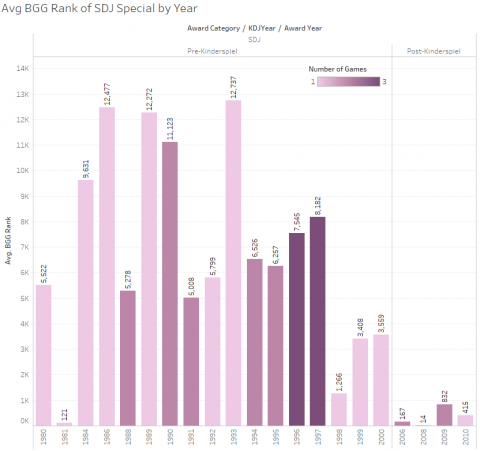
Now let’s ignore the Award Level and look at the best games of all considered by year.
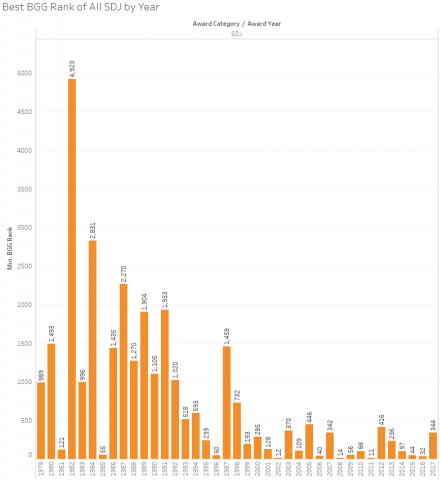
Again, we see a few classics represented and, not surprisingly, newer games generally rank higher.
KSDJ Considered Games
Now on to the KSDJ data. Since the KSDJ has been around for only 7 years it is easy enough to look at the average rank by year and award level. Here is what the highest KSDJ games by year looks like.
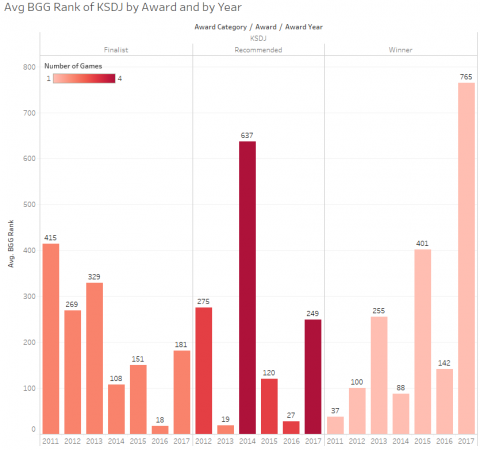
As we saw earlier with the aggregate results by Award Level, the Finalists and Recommended games fare at least as well as the Winners of the KSDJ. 2016 appears to be a particularly good year.
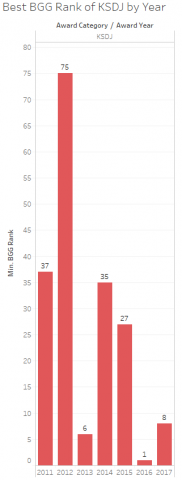
Again, let’s look at the best of the best, the highest ranked KSDJ games by year.
End Game
The SDJ and, in particular, the KSDJ games are well respected on BGG and for a small percentage of all games on the site, have claimed high awards in the BGG ranking. While there is definitely a mixed bag of results, the awards represent what the judges believe to be the best family games for a very specific market, but manage to garner wide attention.
Chicken or the Egg?
Which comes first, the quality that appeals to both the BGG audience and the SDJ judges or a BGG ranking that follows the placement of the awards? Note: this would be really difficult to explore since many of the games have no audience outside Germany until after they are recognized by the SDJ and then gain international distribution. However, in our final article to this series, we will compare the ratings of the 2017 SDJ and KSDJ games at the time the awards were announced to their ratings several months later.
Additional parts to this article are available here:
- Spiel des Jahres & the BGG Community - Part 1
- The Full Weight of the Spiel des Jahres - Part 2
- How do Spiel des Jahres Winners Rate? – Part 3
- Buy and Play Spiel des Jahres Games– Part 4
- What Makes an SDJ Winner? – Part 5
- The Impact of SDJ Consideration – Part 6
Your Turn
Flavor Text
I would really like to see how these numbers compare to the complete list of games in BGG, particularly breaking it down by year produced, but there is no way for me to accomplish that (without full access to the BGG database).
A note about the charts: While the differences in the ratings are generally at the top of the chart, I intentionally kept the Y-Axis to the origin to show how those differences are relatively small compared to the scale.
Note: Although this part of the article series wasn’t published until January 2018, the data was collected in June 2017.